Nifty will retest levels of 4750
- Mitesh Thacker
gives his outlook on the markets today
How should traders approach today's gap down?
One thing is sure, markets are probably opening below 4900. Market has been declining for sometime now, but they need to go back to some kind of earlier price charts to look at what Nifty can do. First thing is that around the 7th or 8th of October when we gapped up from levels of 4750, there was a positive gap between the levels of 4830 to 4860. So, the gap should act as a support level.
My sense is that 4860-4870 would be critical support. Eventually, after 6 days of fall, we might get a bounce back around from those levels today or maybe tomorrow. A retest of 4750 is on the cards and we will drift onwards. We have had negative crossovers on lot of moving averages which clearly indicate that the short term momentum bias will turn on the downside.
Indicators have gone into sell mode. So we must brace ourselves for a test of 4750. The immediate direction remains on the downside. In the market internals, the capital goods and banking sectors are doing a lot of damage. The oil and gas index probably is now placed in a very precarious position.
ONGC is taking good support at 255-260 but is also threatening to break below that and it is an index heavyweight. So that is one area of concern.
Reliance slipped very negatively yesterday and their chart pattern looks slightly weak. So my sense is that it could probably go down to 785-780 and if things turn worse, even lower. The negative factors outweigh the positive factors and therefore we will keep heading downwards.
Nifty, Sensex drift lower, analysts advice investment in pharma, FMCG
NEW DELHI: Indian markets have slipped for 6 days in a row on mounting concerns the European debt crisisis worsening and depreciating rupee.
Worries over the European debt crisis prompted investors to shed riskier commodities, extending their slide from Thursday when prices took their steepest tumble since September.
The dollar index hovered near a six-week high of 78.467 on Thursday, while the euro stayed above five-week lows of $1.3421.
According to experts, global factors are not the only part of the problem while India has lots of domestic issues which have kept investors on the sidelines.
"The global factors are only a part of the problem. The major problem is coming from the local issues and this time in my view India will underperform the rest of the markets globally," said Sandeep Bharadwaj, Head India Equities, Derivium Tradition.
"The most important reason is the rupee depreciation and going forward we expect the rupee go down below its all-time lows of Rs 52 per dollar and head towards Rs 54.5-55 levels," added Sandeep.
Sandeep further added that RBI might not be able to arrest the fall in the rupee primarily because of the fiscal and the current account deficit situation, which is worsening.
For levels to watch out for Nifty, Sandeep said, "In our view 3700-4200 levels on Nifty is possible. We think the level will be achieved. We should achieve 5% to 6% growth for FY12 and FY13 will be lower than FY12 earnings."
"We do believe there is a chance that the downside for Indian markets will continue for some more time. The results season has already gone by which has depressed investors and going forward, people are cutting EPS estimates for the index, 1% to 2% for this year," said Prateek Agarwal, CIO, ASK Investment Managers.
Global voice of Seth Freeman, EM Capital Management also echoed the same thought, he said, "I think India is going to decline further, but the decline may be more as selling pressure intensifies in several emerging market funds which India is part of. However, I believe there is strong probability of at least another 10% downside in US stocks on account of exogenous factors."
"When the markets broke 5000 levels on the Nifty decisively, it was clear that we are heading towards earlier lows which we saw in the recent past which is about 4700-4730," added Ambareesh Baliga, COO, Way2Wealth.
"One needs to step back and just wait and watch because right now most of the stocks seem to be like falling knives and it does not really make sense going out and picking up anything at this point of time," added Ambareesh.
"Market seems to be nervous due to global tremors and Italy's voting on austerity plan. Results for Q2FY12 were disappointing on the PAT front where we observed companies facing margin pressure due to high interest outgo and forex loss in context of volatility and sharp depreciation in INR (~51) creating a discomfort to the markets," said Siddharth Sedani, AVP, Microsec Capital Ltd.
"The 50-share Nifty index is now trading below the 4950-4960 mark. On the hourly charts what we have seen is that the volatility indicators have started to rise which means that we might get into more choppier days going ahead. I would bet on probably 4,850 and then 4,750 being tested in the next few days on the Nifty," said Mitesh Thacker of miteshthacker. Com.
Identifying Stops And Targets
Variations On A Classic
How do you figure out where to place stops and targets? Try using support and resistance levels together with the average true range.
As a broker, I am often asked how to figure out where to place stops and targets. There are, of course, many different methods, ranging from not using them at all to using volatility-based figures. One of the most reliable is the use of support and resistance coupled with the average true range (Atr). I will demonstrate this principle using multiple time frames with two unrelated markets to show how truly universal it can be.
First of all, we must define support and resistance. The most basic understanding of support is a level where prices fail to make new lows. The opposite — the failure to make new highs — is true for resistance. They can be thought of as floors and ceilings.
Support as stop-loss
Figure 1 is a weekly coffee chart. Once the market makes a double low (points 1 and 2), we can use that as a temporary level of support. Observe how the market retraces at points 3, 4, 5, and 6 before it moves away for good. Often, the exact level (56.234) at which the dotted line is drawn is inconsequential relative to any major price points — in this case, 56.000 — when setting a stop-loss.

FIGURE 1: WEEKLY COFFEE CHART. Here you see where the support level is. You can assume that trades at or around 56.000 will serve as entry and exit points in both directions.
There is no guarantee that stop orders will be filled at the trader’s preferred price. Once the stop order has been triggered, it turns into a market order, which is then filled at the best possible price. The fill price may be higher or lower than the price specified by the stop order.
The reason we move down to the next major number is because of a phenomenon known as “group think.” We can assume that most traders think alike and can identify support and resistance just as easily as the next guy. The difference, though, is that traders have different motivations for buying and selling and generally have strong and opposing convictions for the market’s direction. Therefore, you can assume that trades at or around 56.000 will serve as entry and exit points in both directions for many traders.
Manage Your Trades With Elliott Wave
- Closing Your Positions
When should you take a position, where should you take a gain, and when should you call it quits? Here’s how you can identify entry, stop, and target levels for your trades.
The easy part of investing in stocks is getting into a trade. You study the chart, understand the company’s business and fundamentals, find your buy point, and then dive in with big expectations. But what’s next? How do you know when to take your gains off the table, or more important, when to tuck your tail and run when it goes against you?
Should and shouldn’t
Many traders know that you must protect your investment with a stop level, because no matter how much sweat and tears you put into your research, there will be plenty of times when it does n’t matter and the stock goes the other way. The answer for many has been to use a trailing stop — say, 5% below their entry point. This seems like a rational conclusion because it defines your risk at a reasonable level. But who’s to say that the stock did n’t cue up a 5% pullback, just to reload for the next up-leg?
Using an arbitrary target and stop level will get you arbitrary results. Hopefully, it works out in your favor, but if it doesn’t, you won’t know why or what the stock is telling us.
There’s a better way. You have to have a full understanding of your expectations from a stock move, based on what should and shouldn’t happen if the pattern being traded is the pattern you think it is.
No theory can provide you these answers as succinctly as the Elliott wave theory. When used in conjunction with Fibonacci retracement and extension levels, you have a wealth of knowledge about what a stock chart is telling us, when the time is right to take a position, where to take a gain, and when to call it quits because the pattern you thought was playing out is not.
The purpose of this article is to demonstrate how you can access this information so that there are good reasons for closing gains and taking losses at specific points. Let’s run through an actual trade to detail the process.
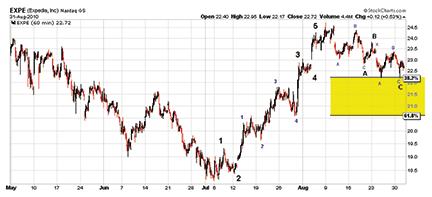
FIGURE 1: TRENDING IMPULSE FOLLOWED BY A CORRECTION. In August 2010, price action on EXPE told us that further upside strength was coming, courtesy of an impulse up followed by a corrective pullback that retraced 38.2%
Stock Pick 9 : ABAN (NSE Code) Signal : Consolidation near minor top. Stop Loss : 390 Target : 450 (Short term)

More Exit, Less Entry
A greater focus on your exit strategy and less on your entry may make a big difference in your overall trading results.
Investors and traders alike devote a considerable amount of time focusing on what investments to make and what tools to use to make these investments. Novices often spend very little time planning the exit strategy. This is the key difference between seasoned traders and novices. In fact, a greater focus on the exit and less on the entry might make the real difference in your overall trading effectiveness.
Why use stops?
When a loss is posted, we always measure it relative to our original holdings. A similar measure is calculated when a profit is posted. It is important to understand the asymmetry built into a loss/win cycle. Figure 1 shows that if you post a loss of 10%, it will take a percentage gain of 11.1% to recover. Okay, you can live with that as a recovery target. So what happens if you post a loss of 30%? It requires a recovery of 43% above your present net holdings to get back to your original account value. What happens if you lose 80% of your holdings? Well, that will require a 400% price move to recover your losses — not much chance of that in today’s markets. The lesson here is to cut your losses early. That is where the proficient use of stop alerts comes in.
Consistently deploying stops can be painful, but it will allow you to know the maximum limit of your loss in advance, moving you away from later stage fear–based decision-making that can occur when a trade goes against you. It’s already been decided in your trading plan; you exit with a controlled loss.
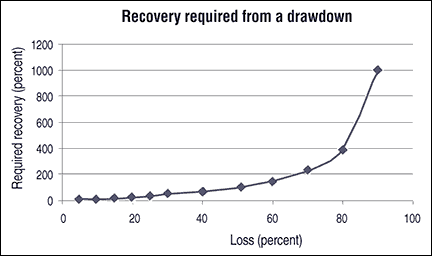
FIGURE 1: RECOVERY FROM A DRAWDOWN. A loss of 10% will take a percentage gain of 11.1% to recover. A loss of 30% requires a recovery of 43%. A loss of 80% of your holdings requires a 400% price move to recover your losses.
No comments:
Post a Comment